

Are You Sitting on More Equity Than You Think? A Simple Guide for Homeowners
Kitchen Table Analysis · Homeowner Insights
You may have more options than you realize.
Understanding your home equity can help you plan your next move—even if that move is staying put.
If you’ve owned your home for a while, you may be sitting on more equity than you think.
A ResiClub analysis published by Fast Company reported that 40.3% of U.S. owner-occupied homes were mortgage-free in 2024, using Census Bureau data. That was up from 39.8% in 2023 and 32.8% in 2010. Read the original analysis.
That national trend is interesting. But it doesn’t tell you what your home is worth or how much equity you have. For that, we need to look at your property and what you still owe.
You don’t need to be mortgage-free—or planning to sell—to benefit from knowing those numbers.
Curious where to start? Explore my Homeowner Resources page.
What Home Equity Really Means
Home equity is the difference between your home’s current value and the debt secured by it. That includes your mortgage and any outstanding home-equity loan or HELOC balance. The Federal Trade Commission explains the basics here.
A simple example
Estimated home value: $600,000
Minus total debt secured by the home: $200,000
Estimated equity: $400,000
Illustration only. This is estimated equity before selling expenses, not a promise of cash proceeds or an amount a lender will let you borrow.
Equity can grow as you pay down principal and when your home’s value increases. It can also shrink if values fall or you take on additional debt against the property.
It doesn’t grow at a guaranteed or predictable rate. And only the principal portion of a mortgage payment reduces your loan balance—not interest, taxes or insurance.
That’s why it helps to review both sides of the equation: a realistic value estimate and up-to-date loan balances.
More Homes Are Owned Free and Clear
The chart below shows the national share of owner-occupied homes without a mortgage rising from 32.8% in 2010 to 40.3% in 2024.
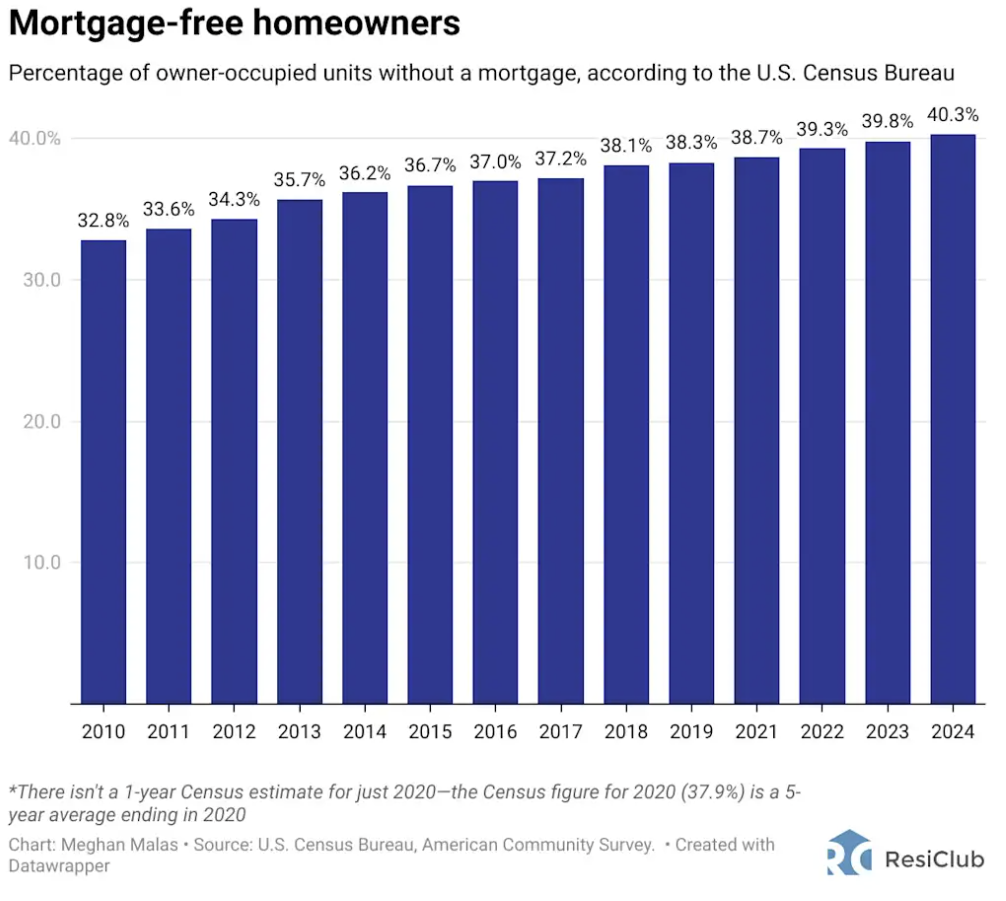
These figures describe mortgage status, not the dollar amount of equity in each home. A homeowner with a mortgage may still have substantial equity. A mortgage-free homeowner still has property taxes, insurance, maintenance and other living expenses.
Time Helps Explain the Pattern
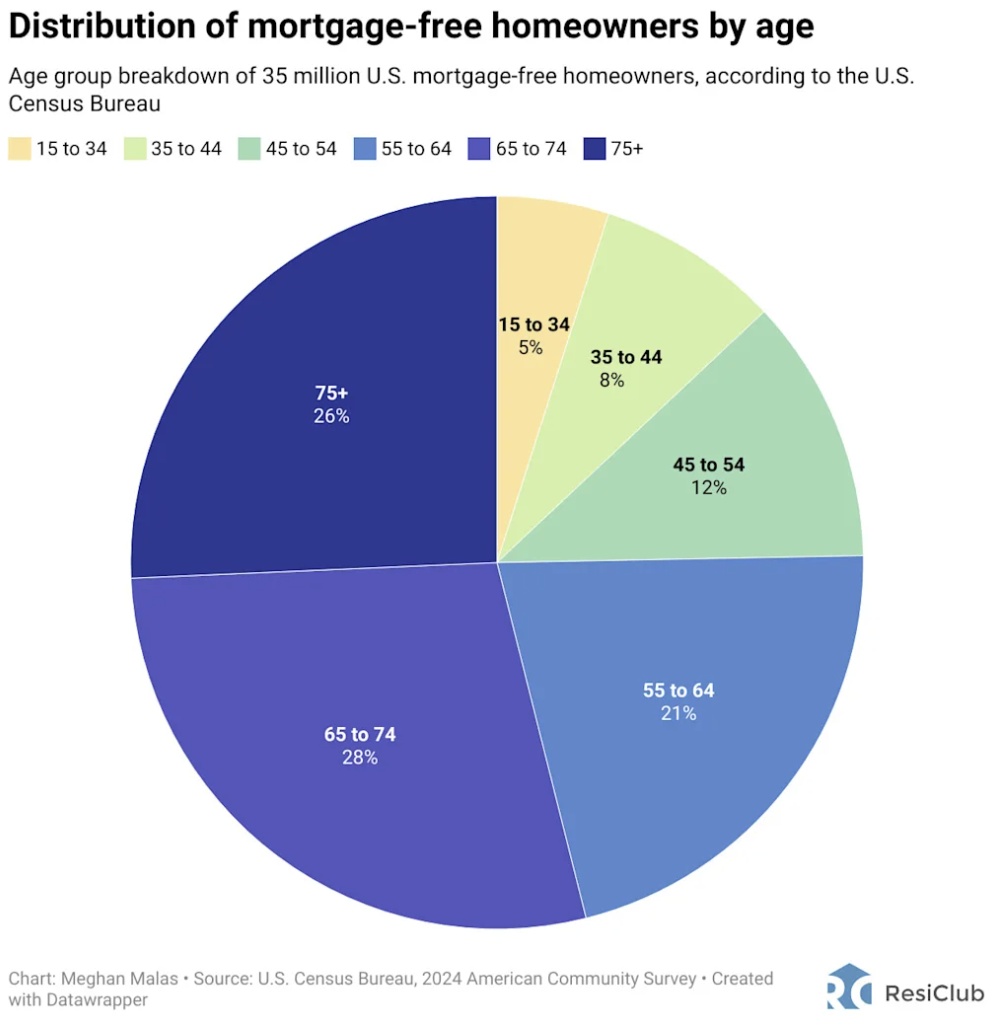
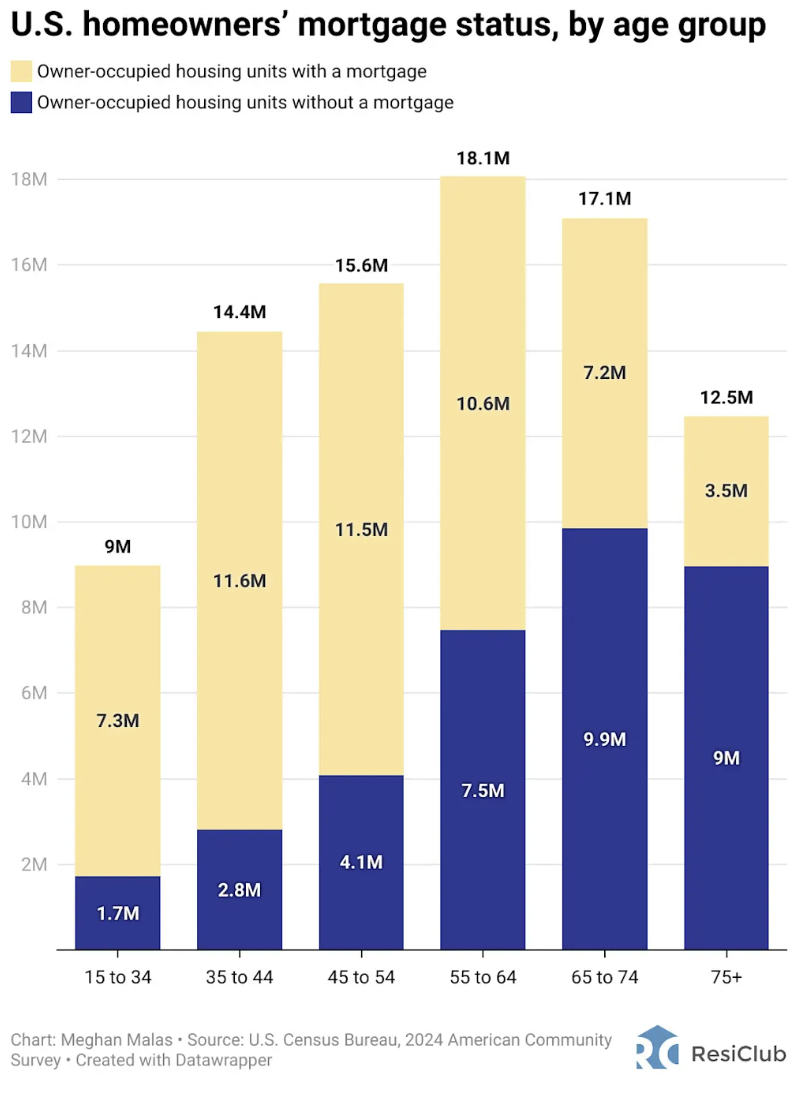
Older homeowners have generally had more time to pay down a mortgage. The age charts help illustrate that pattern, but they answer two different questions.
Who makes up the mortgage-free group?
In the chart below, homeowners ages 65–74 account for 28% of the mortgage-free group, and those 75 and older account for 26%. Together, that’s about 54%.
How does mortgage status differ by age?
This second chart compares homes with and without mortgages within each age group. It shows that owning free and clear is more common in the older groups.
What This Means for You
Having less mortgage debt can create breathing room. But the national mortgage-free share doesn’t guarantee financial security for an individual household or predict where local home prices will go.
For your own planning, the useful question is: what choices could your equity support, and what would each choice cost?
Options worth exploring
- Downsize or simplify. Compare possible sale proceeds with the cost of your next home, moving and ongoing ownership.
- Improve the home you have. Consider renovations, repairs or accessibility changes that make daily life work better.
- Plan another purchase. Review financing, cash reserves and the costs of keeping your current home before committing.
- Support longer-term goals. Discuss major gifts, retirement plans or other financial decisions with the appropriate advisor.
- Stay put. Understanding your equity does not create an obligation to sell, refinance or borrow.
Equity Isn’t the Same as Available Cash
If you sell, the amount you keep depends on the actual sale price, loan payoffs, closing expenses and other applicable costs.
If you stay and borrow against the home, a lender decides how much you qualify to borrow. Your estimated equity is not automatically your borrowing limit.
A home-equity loan generally provides a lump sum. A home equity line of credit, or HELOC, lets you draw funds under the account’s terms and commonly has a variable interest rate. Compare the two with the CFPB.
Borrowing against equity creates a repayment obligation.
Your home is collateral. Payments, fees and possible rate changes belong in the decision, and failure to repay can put the home at risk. Read the CFPB’s HELOC overview.
Start With Your Home, Not a National Average
It’s easy to anchor your thinking to what you paid years ago or to an online estimate. Neither necessarily reflects what buyers would pay for your home now.
A useful review looks at recent comparable sales, competing listings, your home’s condition and location, and the balances of any loans secured by the property.
In Oakland County, even nearby neighborhoods can have different price ranges and buyer demand. Local comparisons help turn a broad estimate into a more useful planning range.
If you’re considering selling, we can also estimate expenses so you can compare potential net proceeds with the cost of your next step.
Sometimes, understanding what you already have is the smartest move you can make.
Curious about your home’s equity?
Start with my Homeowner Resources page. If you want a closer look, I’m happy to walk through local comparisons and help you understand your options. You don’t need to be planning a sale.
Explore Homeowner Resources →Prefer a conversation? Schedule a call with Mike. No pressure. Just clarity.
Make the most of the home you own
Browse my free home guides for maintenance, home safety, seller preparation and closing costs. No registration required.
Want local market context in your inbox? Sign up for Homeowner Intelligence.
```
Categories
Recent Posts